Experiment of The Month
From Reality to Force Components
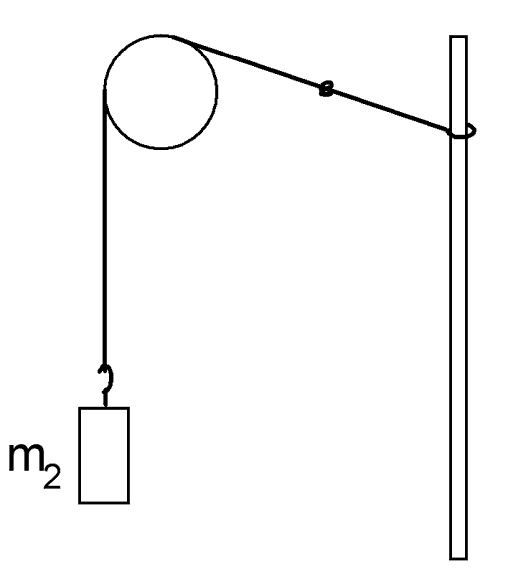 Physicists of a certain age remember "force tables," laboratory devices that had pulleys and strings and weights that had to be arranged to make the net force on a central ring equal to zero. They were so hard to balance that it was easy to lose sight of the fundamental principle of the vector addition of forces. This month's apparatus is a much simplified version, which demonstrates the summation of forces and tests the ideas of vector components.
The particular implementation here brings up one of the pitfalls of beginning physics: sliding too easily from real things and events to abstract cosmic pronouncements. For example, students observing a weight spinning on the end of a string are tempted to write in their lab notebook, "Today we verified Einstein's theory of relativity. In this month's experiment, Dr. Miziumski takes special care to notice what things are real and what statements are interpretations of reality.
The experiment begins with a piece of string tied with a loop at the left to a post, passing over a pulley, and attached to a weight m2, as shown in the upper right hand figure. We hang a second weight from the knot shown in the lower figure at right, and observe the consequences.
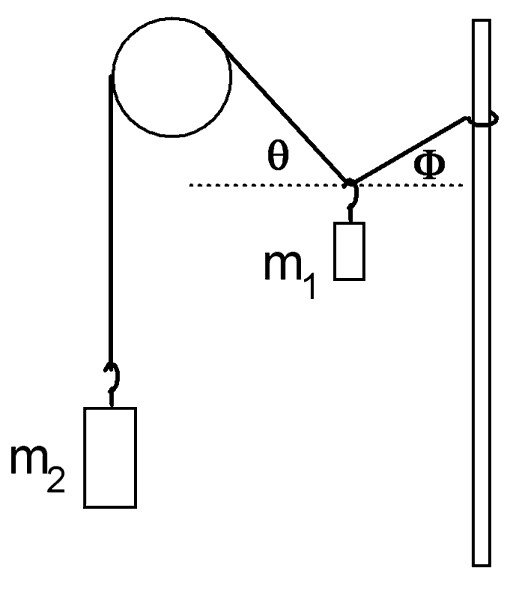 The second mass that we put on, called m1, is smaller than m2. For a wide range of choices of m1 , the system "balances:" The string sags down with m1 pulling on the knot, and eventually comes to rest, with all pieces of the system at equilibrium.
We seek parameters to describe the behavior of the system. As is often true, it helps to divide the parameters into "independent" variables and "dependent" variables. The distinction is more personal than physical: An independent variable is one that I can change directly with my hand. A dependent variable is one that changes in response to my modification of the independent variable. In this system, the sizes of the weights are identified as independent variables. The "shape" of the system that results is to be measured by the dependent variable(s).
We ask, "What are the conditions of equilibrium for this system?" That is, we ask for the relation between dependent and independent variables, when the system is at equilibrium. We start by investigating the independent variables.
We imagine what would happen if the force of gravity were stronger. For example, suppose that the strength of the gravitational field were doubled, so that the weight of each mass is doubled. It seems plausible that the system would look just the same. We test this guess by doubling the system: hang a second weight of mass m1 at the knot, and a second weight of mass m2 on the right end of the string. We find in fact that the system does not shift in response to these changes.
On the other hand, if we double only the mass m2 , the system does change its configuration, with the doubled m2 sinking lower (and m1 rising higher) as equilibrium is reached. Evidently the size of the masses does not change the equilibrium, provided that the *ratio* of the masses remains the same. This gives us a welcome simplification: The independent variable that is most useful here is the ratio of the two masses, ( m1 )/ (m2 ). (We made a lucky guess about which mass works most nicely in the numerator.)
We next need parameters to describe the shape of the system. When the small weight m1 is added, the string bends, forming two angles; one on each side of the knot, called q and F. To simplify our problem, we restrict the angles which we will allow. We require that the string to the left of the knot be horizontal. Referring to the second figure, we require that the angle F be zero. In order to make this happen, we must do extra work: We must slide the loop up and down the pole until we make the left side of the string horizontal. Luckily we find that it is possible to do this for a fairly wide range of mass ratios.
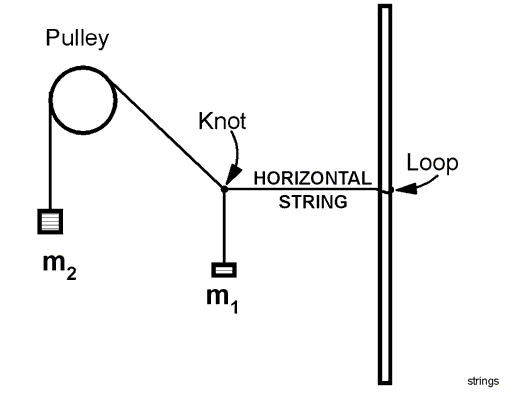
Our experiment now looks like the figure at the right. Because we have been studying force components, we have an urge to start calculating forces. But wait....
Let us not be prejudiced by the force rules that we have learned. Let us see what we can learn without their help. Returning to the basics, we ask "How can we describe the state of the system for a given mass ratio?" With the restriction that F=0, we can describe the system by stating value of the angle q . q is the most valuable dependent variable.
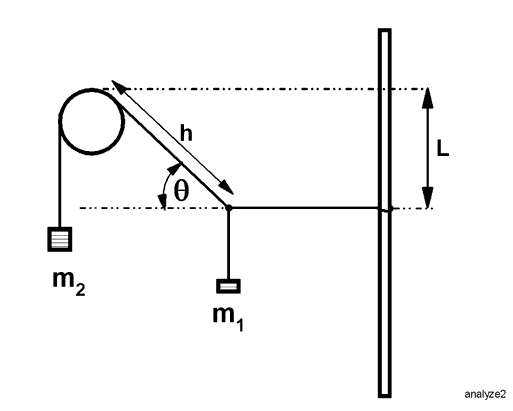
Now we go to work collecting data. We vary the mass ratio and measure the angle that the string makes with respect to the horizontal. A sample set of data is displayed below. In this data set, m1 was held constant at 50 grams. Because we will be working with ratios and angles in radians, the units are left in ordinary bench-top units (grams and cm) and not converted to SI units. The units will cancel.
| m2 | 60 | 70 | 80 | 100 | 100 | 120 | 150 | 200 | grams |
| hypotenuse, h | 60.5 | 67 | 60.3 | 56 | 55 | 52.5 | 51 | 50 | cm |
| vertical drop, L | 50.6 | 47.7 | 39 | 28 | 28.6 | 22.8 | 16.5 | 13 | cm |
The terms in the table refer to the figure at the right. To measure the angle q , we will use the right triangle formed by the pulley, the knot and the horizontal dashed line. The hypotenuse of this triangle is called h, and the vertical leg has length L. Having collected the data, we try to think about what have observed, and not what we remember having learned from a book. To search for a relation between the dependent and the independent variables, we try a graph.
The graph below uses the mass ratio. The data fall nearly on a straight line, so it is tempting to fit a straight line through the points. A straight line fit is shown. The correlation coefficient is represented by R2. R2=1 for a perfect fit, so the straight line fit seems to be good, but this turns out to be a snare and a trap.
A convenient rule of thumb for graphing is that data are represented by points, and theoretical expectations are represented by lines. With that understanding, we are required to understand the meaning of the parameters of a line which is fit to data. In seeking this understanding, it helps to explore the extremes of the independent parameter, ( m1 )/ (m2 )
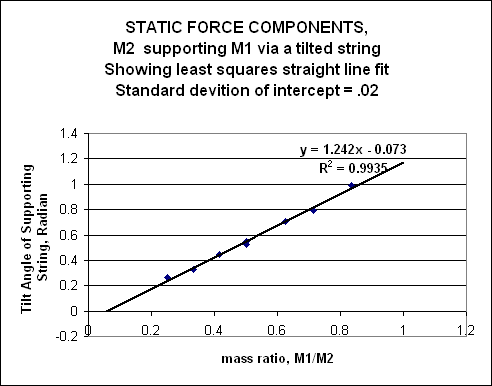
A straight line fit to the data indicates that when the ratio is zero the angle is about - 4 degrees with an uncertainty of about 1.5 degrees. It is easy to test this prediction experimentally. To make the ratio zero, we just set m1 equal to zero; we take the mass off altogether.. But in that case, the string on both sides of the knot should be simply straight, and the angle q should be zero. The line predicts that the string will bend "the wrong way."
At the other extreme, the straight line predicts that m1can be greater than m2 . Experimentally, if this happens, the knot is pulled down until m2 is pulled over the pulley and clatters to the floor. These contradictions make us certain that a straight line fit will not give us insight into the relation between the dependent and independent variables. For insight, we turn to Newton.
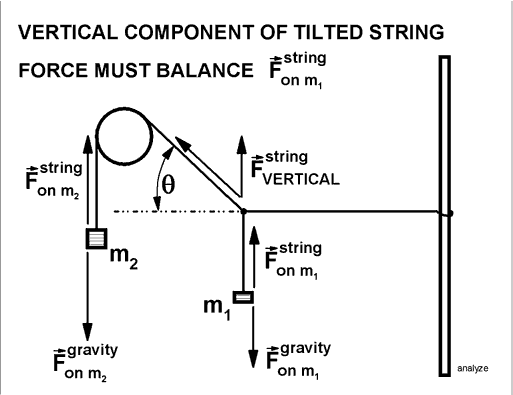
Finally, we seek to improve our understanding using the physics learned in class. We require that the vertical component of the force by the string on m1 plus the force of gravity on m1 must add to zero for equilibrium. For an ideal pulley, the tension in the string to the left of the know is the same as the tension m2 so we must have
(m2 ) (sin q) = m1 so that
(m1)/(m2) = (sin q)
or
q = arcsin[(m1)/(m2)]
When the straight line fit is replaced by a line representing q calculated as above, the line represents theory based on Newtonian mechanics. The graph is shown below.
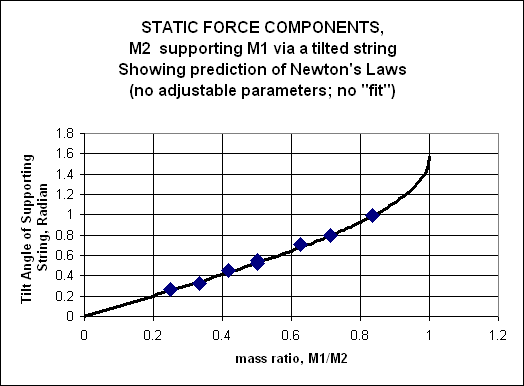
The curve fits the data well, and has the additional advantage of going through the origin, as expected. It also suggests that there are no solutions for m1 > m2 , as we expect. We should emphasize that in this second graph, there are no adjustable parameters; no "fit." The first graph had two adjustable parameters, slope and intercept in the "fit," neither of which turn out to have simple physical significance.
The upshot: Use "fits" to help build insight, but don't assume that the guess for the form of the fit has any significance, until you can show how it arises from the basic physics.
-
Contact Information
Contact Number: 717-871-4297
Email: physics@millersville.edu