Experiment of The Month
Energy in the Atwood's machine
 The Atwood's machine is traditionally used to measure the gravitational field strength (aka free fall acceleration). This experiment uses the machine and automatic data collection to track the energy of the system.
In the figure at right, the string has been colored black for better visibility. The heavier (570 instead of 550 gram) mass sits on the cage that protects the sonar ranger. The pulley was selected to be one of our newer Cenco pulleys, which have higher friction than the older models.
To begin the experiment, the LoggerPro ranger software data collection is turned on and the lighter mass is given a downward push. With a little practice the lighter weight can be made to travel almost to the floor before it starts back up again.
The position and velocity record, as a function of time is taken from the LoggerPro files and copied to an Excel spreadsheet. The kinetic energy of the system is calculated as (1/2)(1.12kg)(v^2) for each time in the table.
Because one mass goes up as the other goes down, the potential energy of the system is nearly constant, rising when the extra 20 grams on the heavy mass rises. It is convenient to choose the potential energy to be zero at the highest point of the 20 gram weight's path. That point is easy to identify because the velocity measured by the sonar ranger is zero there.
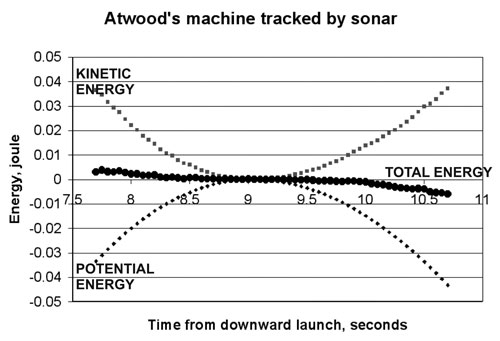
With that choice, the potential energy is always negative, and the total energy is zero when the heavy weight reaches the top of the path. If energy is conserved the total energy remains zero always. A graph of the three energies as a function of time is shown below, beginning with the high kinetic energy and large negative potential energy when the light weight is thrown downwards.

The total energy remains nearly constant, but clearly decreases from the start to the end of the experiment. Near the center of the pattern, where the velocity is near zero, the energy seems to be constant. The energy loss rate is greatest where the velocity is large. This is consistent with a friction energy loss, whose rate is equal to the friction force times the velocity.
If the energy loss is due to friction, we can calculate it as the product of friction force with displacement. Remember that the friction work is always negative because the friction force always opposes the displacement.
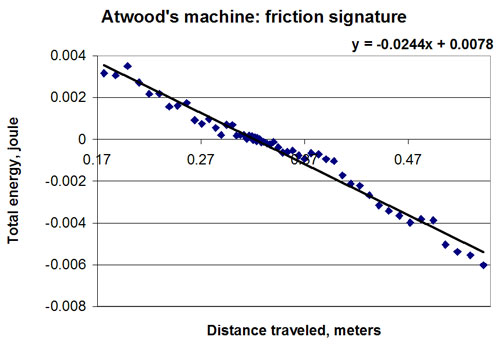
If we assume that the friction force is constant in magnitude, we can say that the friction work is equal to the friction force times the distance traveled (a magnitude). The energy loss due to friction is then proportional to the distance traveled. Below is a plot of total energy versus distance traveled. (Distance traveled is the sum of the magnitudes of each successive position change. A typical Excel cell reads =B23+ABS(D24-D23) when the position is in column D and the distance traveled is in column B.)

The slope of this graph indicates a constant friction force of .024 Newton, with an uncertainty of .0005 Newton.
-
Contact Information
Contact Number: 717-871-4297
Email: physics@millersville.edu