Experiment of The Month
Galileo's Method for Rolling Hoops
Our labs do not have written instructions. In keeping with this spirit, the description given here will be brief and general. The intent is that each performance of the lab will be unique; in each nature will reveal a slightly different face to the observer.
In the previous month's
We use a gently sloping ramp (falling 5cm in 100 cm), with supports underneath to reduce sagging. We release the hoop from rest and measure the distance traveled as a function of time.
Galileo did the experiment with a musician keeping time, with markers along the ramp to record the position of the rolling ball at each beat of the drum. We use a metronome to sound the time and post-it tabs to mark the positions.
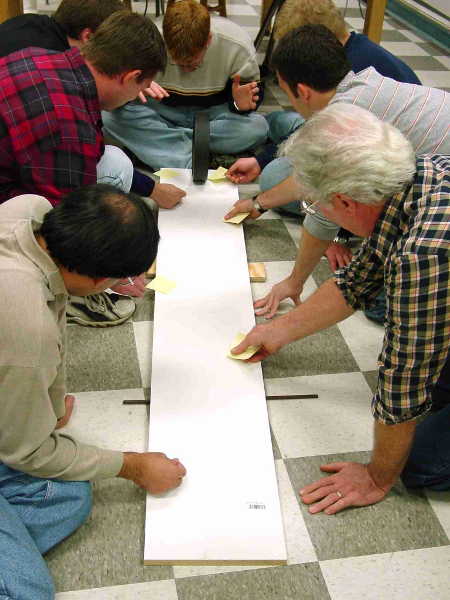
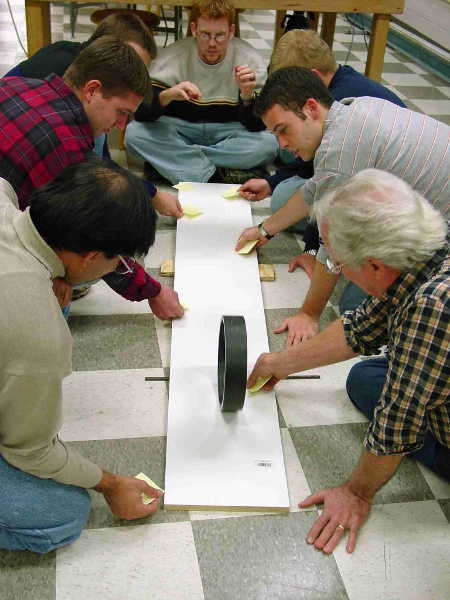
In the first picture, Jeff Barrage is about to release the hoop on the "zeroth" tick of the metronome, and 6 other physicists wait their turn. On the first tick, Harry Nash puts his marker at the position of the hoop. Matt Panas puts down the second, Dave Neidig is third, James Marek is fourth, Dr. Miziumski is fifth, and Dr. Gilani is 6th.
The figure shows the pattern of markers, with a
| Hoop on |
||
| 80 beats per minute | ||
| tick #, "t" | t^2 | Distance rolled |
| 0 | 0 | 0 cm |
| 1 | 1 | 5 |
| 2 | 4 | 17 |
| 3 | 9 | 43 |
| 4 | 16 | 67 |
| 5 | 25 | 99 |
| 6 | 36 | 138 |
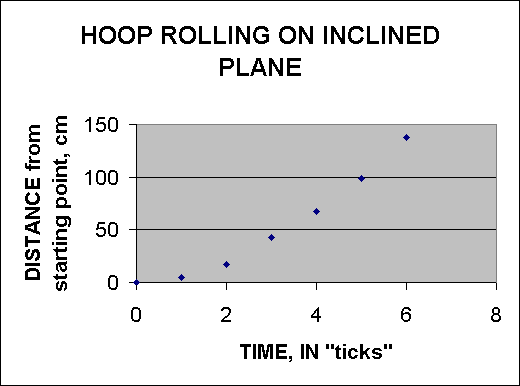
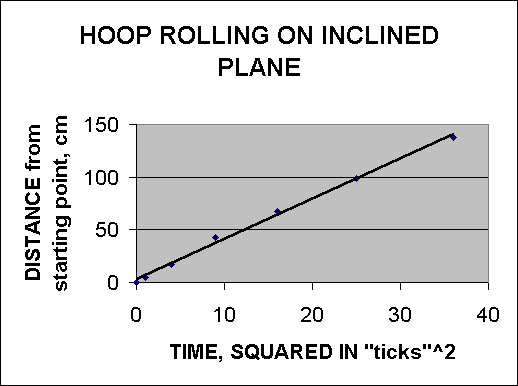
The data collected from the picture above are tabulated above. A plot of position versus time (below) shows a curve whose slope increases regularly. It looks like a parabola, and this appearance can be tested by plotting position versus time squared. In the figures, time is measured in "ticks" of the metronome. In the experiment, the time between ticks was .75 seconds.


The fact that the second graph is a line tells us that the distance traveled is proportional to the square of the time elapsed. Galileo's method of measurement gives cleaner results than most motion experiments.


