Experiment of The Month
Error is Natural
Earlier discussion of the propagation of error using calculus concerned the error in a quantity calculated with a formula, due to errors in the numbers used in the formula. For example, if g = 2 h/(t2) then errors in determining the values of t and h cause error in the value for g.
Students trying hard to make a good measurement are asking, "How can I do this right?" It is difficult to shift to the question, "How can I do this wrong?" We don't want to do it wrong, and if we think of a way to do it wrong we naturally avoid that. That seems to leave no way to estimate the possible error. (The politically correct term is "uncertainty.")
This still can leave a student with a sense of having done something wrong to cause the variation. The following demonstration offers comfort in that there are cases in which it is not the experimenter that is wrong. Rather, it is simply wrong to assign a single number to the result of an experiment.
Wrong as it is, we go ahead and do it and (perhaps to our surprise) find that using these numbers in our mathematical models gives us numbers that correspond nicely to the real world.
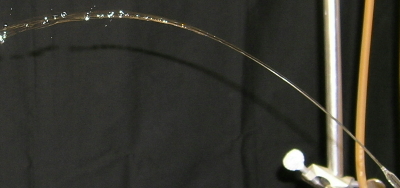
We shoot a stream of water through the air with a miniature "water cannon" and ask, "What is the range of the water cannon?" The figure below shows the setup

Overview of setup

Closer view of pipette nozzle and the first drops breaking up
The water is fed from a water faucet (on the right) up to a blue
This constant pressure drives water down the hose that leads to the pipette. Some care is necessary to remove air bubbles from the hose. Bubbles restrict the flow and shift with time.
The water stream breaks up into drops before it returns to its original height. The range of some water is longer than other water.
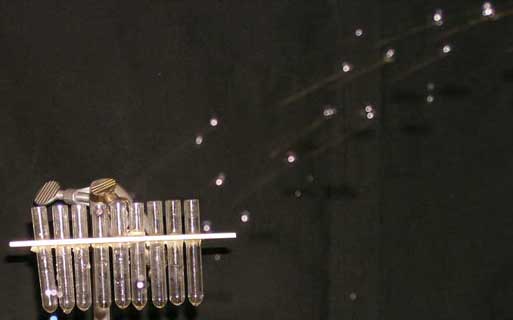
A more detailed picture of the water distribution is made with the row of test tubes shown below. The tubes, called ignition tubes, are 5mm inside diameter. are spaced about 1cm apart. The distance from the right-most tube to the pipette nozzle is
The array of tubes is pushed under the falling water drops so that the water begins to fill the tubes. The result is shown below at the right. (Dye was added to the water to make it more visible.)


The tubes show a natural distribution of the water drops. With this visual reminder in hand, we can ask for the most probable range. We can assign 1mm vertical height in the tube to a single drop, and ask for the average range of all drops. We can ask for the uncertainty and use this to lead to a discussion of standard deviation and width of a distribution.
-
Contact Information
Contact Number: 717-871-4297
Email: physics@millersville.edu