Experiment of The Month
Observation of Free Fall Acceleration
Our labs do not have written instructions. In keeping with this spirit, the description given here will be brief and general. The intent is that each performance of the lab will be unique; in each nature will reveal a slightly different face to the observer.
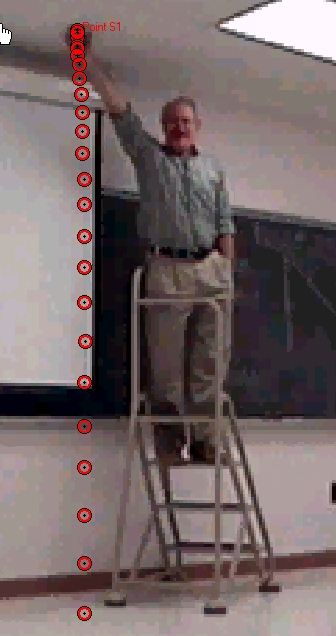
Our students learn to make and analyze digital movies of physical events. The introductory exercise is to measure the acceleration of a falling ball. Each table (with three students at the table) has a video camera, connected to their computer. They adjust their cameras to frame the teacher on a ladder, and the trajectory of the ball. The ball is dropped and the video is recorded on the computer hard drive.
Using VideoPoint software, they click on the location of the ball in successive frames of the video record. The software stores the location, in the frame, of each clicked point. In a separate routine, they click on the two ends of a meter stick. With that information, the software produces a table of position as a function of time.
In the figure, the clicked ball locations are indicated, giving a nice visual indication that the velocity is not constant. (The time interval between the ball's arrival at each location is constant, approximately 1/60 second.)
Students take the data to a spreadsheet. There they calculate average velocity using adjacent time records. This velocity is plotted versus the time. The velocity points on the graph are scattered about a straight line.
Students find the slope of the straight line that fits the data. ( Methods for doing this calculation vary from instructor to instructor.)
Students believe in the veracity of slow motion video, so this experiment is a nice introduction to the ideas of velocity and acceleration.
In the earlier version of the falling ball experiment, the time to fall to the floor was measured and the results analyzed. At first glance it might seem that the current experiment is an unequivocal improvement. However, something was lost:
In the earlier experiment we proposed two models (constant velocity and constant acceleration) for how a ball falls. Data take from a 1 meter drop can be interpreted to yield the value of either the "constant" velocity or the "constant" acceleration. In order to test the models, each is used to predict the time of fall for a 2 meter drop, based on the 1 meter drop results.
The constant velocity model predicts a doubling of the fall time, while the constant acceleration model predicts an increase by a factor of 1.4 (square root of 2). The experiment is done, and the results used to decide which model better describes the falling ball.
The earlier experiment presents a microcosm of physics at work; experiment, analysis, prediction, test. The current experiment is good at communicating the concepts of velocity and acceleration. At the end of this experiment you find your self in the same position as you are in the check-out line of a supermarket. You have the groceries, but you have not begun to cook.
In our course, the cooking for this lab is done in lecture, with stop watches in the hands of a dozen students. We measure the time for a 1 meter drop, predict the 2 meter time with each model, and test the prediction. In addition to eliminating the constant velocity model, the data provide motivation for error analysis in future laboratory exercises.
