Experiment of The Month
Reconstruction of a Musical Tone
Musical instruments differ from
Music majors at Millersville develop their ability to produce pleasing or evocative tone quality with their instruments. Music majors are required to take a one-semester musical acoustics course in the Physics Department. Among other things, in this
From a scientific point of
In the beginning, we used oscilloscopes to analyze musical tones, but most of our analysis is now done with software called CoolEdit2000. A demonstration version is available for free at http://www.syntrillium.com/cooledit/index.html
In a PC with a sound card, the software allows recording, analysis, and production of sound. An example of the process uses an ancient musical tool called a tuning fork. (Back in the days when telephones had dials, tuning forks were the frequency standards used to tune pianos.)
Tuning forks were intended to produce nearly pure tones, but they have significant overtones and thus a distinct tone quality. The number of important overtones is small compared to musical instruments. This fact makes it easier to use CoolEdit to construct a replica of a tuning fork sound.
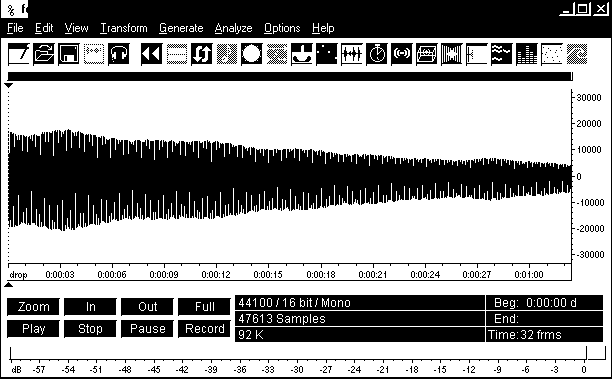
The tuning fork is tapped and the sound recorded using the computer microphone, sound card, and CoolEdit software. The signal versus time graph is shown below:
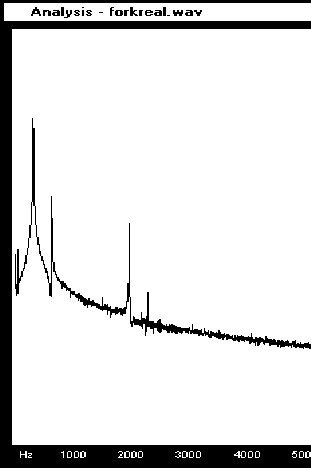
This signal is analyzed using the CoolEdit Fourier transform tool, producing a plot of sound intensity as a function of frequency, as shown at the right. the fundamental tone is 320 Hz, and two overtones are easily discerned. The overtones are not simple multiples of the fundamental because the vibration pattern of the tuning fork is (roughly) that of a bar, rather than that of a taut string.
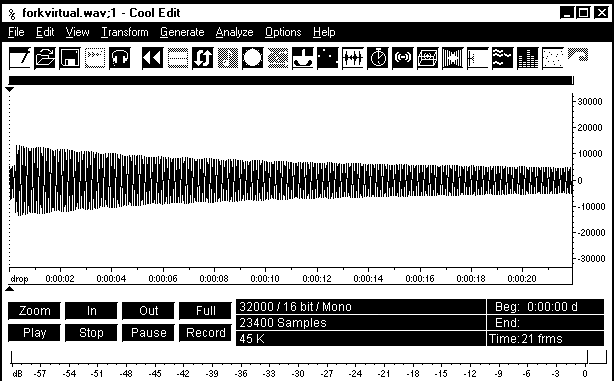
The tone-generating tool is then used to produce a tone with the same fundamental, and the same amplitude overtones. The synthesized tone has the signal versus time graph plotted below.
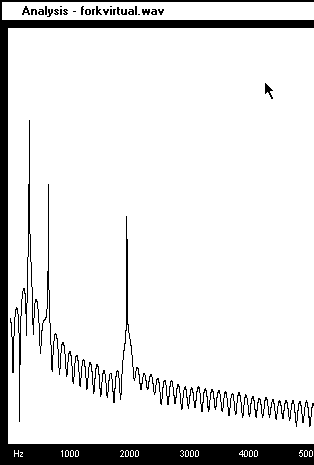
The spectrum of the synthesized tone is plotted at the right. Compare to the spectrum of the original tone, above.
Wave files of the two tones, real and synthesized are available for your comparison. Dr. Grosh, who developed this exercise, reports that the music majors have been impressed with the similarity of the two tones.


