Experiment of The Month
Velocity Field in a Pipe
 When real fluids flow in a pipe, flow is limited by a kind of liquid friction called viscosity. As a first model for viscosity, we can imagine a trough of viscous fluid, like sugar syrup, as sketched below. We place a microscope slide, edge down, in the fluid, and pull it to the right. The viscous force, like friction, acts to oppose motion. The microscope slide is in the middle of the trough, so we feel equal force from fluid above and below.
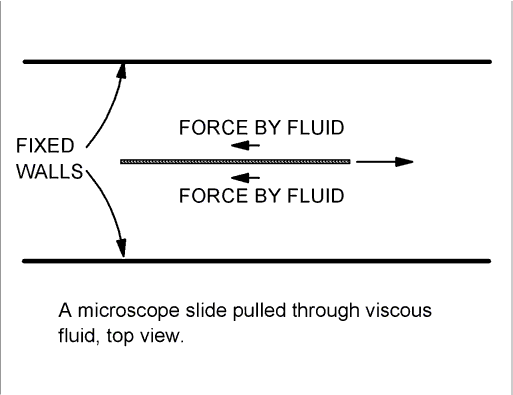
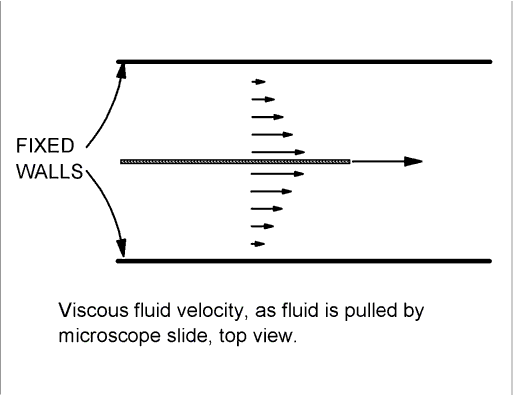
We use a simple rule to think about how the fluid behaves when we pull the slide through it: Syrup touching a surface sticks to it. That is, the fluid which touches the walls is at rest with respect to the walls, and the fluid which touches the microscope slide moves along with the slide. In the regions between the slide and the wall, the fluid velocity decreases as we look nearer to the wall.
Detailed calculations show that the fluid velocity is proportional to the distance from the wall. A sketch of the fluid velocity field is shown below. The length of each arrow indicates the size of the fluid velocity in the neighborhood of the arrow.
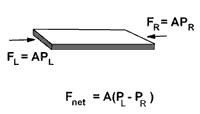
As a step towards flow in a pipe, we imagine replacing the microscope slide with fluid. Of course, it's not possible to just pull the sample along the trough. To make the fluid sample move, we use pressure and exert forces on its left and right ends. In the picture at the right, the slide has been turned on its side so that we can see its left end. In order to force the sample to move towards the right, the pressure on the left must be larger than the pressure on the right.
The resultant force due to pressure depends on the pressure difference, as indicated by the equation in the figure. If this pressure difference were applied only to this sample of fluid, the results would be the same as with the microscope slide. In practice, though moving water with pressure is a little different. We generally apply high pressure at the left, and allow the right to be at low pressure.
The pressure is applied to all of the fluid on the left, and not just our sample. This means that each bit of fluid feels a pressure force pushing it to the right. It is still true that the fluid which touches the wall sticks to the wall, but now there are two forces pushing downstream: the same viscous force as before, and also the pressure force. Near the center of the tube, a sample of water does not fall behind the middle sample as rapidly, because the pressure force helps it along downstream.
Detailed analysis shows that the velocity field should have a parabolic shape, rather than the linear shape for the microscope slide. This derivation is done in Physics 334, Macroscopic Physics and Thermodynamics, for our sophomore physics majors. The figures below show a demonstration of this shape. Chris Kunkle filled a 3 cm diameter tube half way with green dish soap, and carefully poured yellow dish soap on top of that, so that the interface is well defined. We remove a plug at the bottom of the tube, allowing the viscous fluid to flow downward. Because the velocity at the center of the tube is highest, the center of the interface moves down more rapidly. The qualitative shape of a parabola is visible in the still photos.
 |
 |
 |
| Yellow dish soap above green soap in a a 3 cm diameter tube |
At the beginning of fluid flow, the interface bows down in the center |
A more fully developed flow pattern |
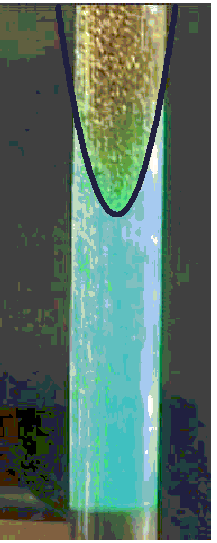
In each succeeding snapshot, fluid has flowed for a longer time. If each bit of fluid flows at a constant velocity, then the position of the bit at a given time is proportional to the velocity of the bit. If the velocity distribution is parabolic, then the positions should reflect this distribution. The position of the interface shows a satisfyingly parabolic shape, as suggested in the figures below.
The assertion that the fluid has zero velocity at the walls is seen to be nearly verified by the thin blue layer that remains on the higher parts of the wall.
 |
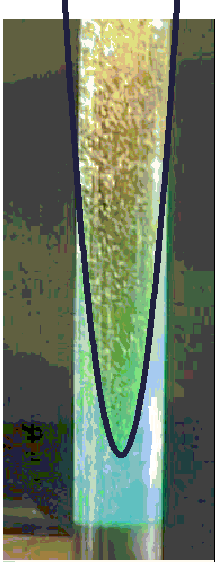 |
| Parabola sketched on interface | Parabola sketched on interface |
A video record of the experiment is available here.
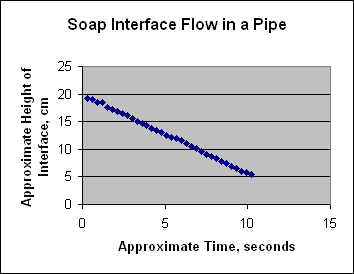
The assertion that the velocity of each bit is constant was tested by estimating the frame-by-frame change in position of the lowest part of the parabola. A graph of the measurements is at the right. The linear shape indicates constant velocity of about 1.5 cm/sec.
-
Contact Information
Contact Number: 717-871-4297
Email: physics@millersville.edu