Millersville & Lancaster Area Climatology
-
Recent Data
Back to top- This Month's Data: Millersville University
- MU's current monthly "Climogram"
- MU's current monthly "Precipogram"
- MU's year-to-date temps (plotted weekly)
- Yesterday's Climo: Harrisburg, Williamsport, State College
- Yesterday's Statewide: High/low/precip
- 3 Day Weather Observation History: Lancaster Airport
- NWS monthly summary interface: PHI | CTP | PIT
- NWS Co-Op Archive (NOWData): CTP | PHI | PIT | CLE | BGM
-
Local Data Archives
Back to top- Monthly Summaries: MU/Lancaster (since 1914)
- Climograms: MU/Lancaster (since 1914)
- Precipograms: MU/Lancaster (since 1914)
- Hourly Data: MU Weather Station (5/98 - Present)
- Meteograms: 24-hour Data Plots (3/10 - Present)
- Search for past METAR (hourly) reports
- Monthly Temp. Departures (Using 1914-2020 Normals): 1914-2026
- Monthly Precip. & Departures (Using 1914-2020 Normals): 1914-2026
- Monthly Precip. Most- and Least-Ever
- Mean Monthly Data: High/Low/Precip/Degree Days
-
Other Data
Back to top- Daily Sun and Moon Data
- NOAA Sunrise/Sunset Calculator
- NOAA Solar Position Calculator
- Local Wind Rose (MDT) Avg. Speed & Direction
- PA Tornados (1950-2015): Plot of Tracks | Lancaster-Lebanon tornado plots (abridged) | Lower SusQ tornado plots (abridged)
- U.S. Tornadoes: SPC Tornado Archive (since 1950) | Tornado Tracks/Intensity by State
- Historical Temperature and Rainfall Statistics: Major PA Cities | Statewide (PA)
- A Severe Weather Database (SPC)
- Radar image archive
- Historical SST Anomalies (since 1996)
- Daily Map Archive
- For Comprehensive Climatological Data go to National Climatic Data Center
-
Analog Data
Back to top- PSL Climate Division Data (since 1895) | Monthly/Seasonal Climate Composites (since 1948)
- Historical ONI Index (Since 1950) | By Region
- NCEI Regional Climate Centers
- Winter Storm Archive (1993-2013)
- NCEP National Temp. and Precip. Maps (since 2001)
- List of 66 NESIS Snowstorms
- Historical NAO Index by Month (since 1950)
- Historical AO Index by Month (since 1950)
- Historical PNA Index by Month (since 1950)
- CIPS Analog Threat Guidance
- Climate Predict Teleconnection Analogs (since 1948)
-
Normals & Records
Back to top -
Snowfall, Freeze & Heavy Rain Data
Back to top- Seasonal Snowfall: 1926 - 2026 | graph
- Decadal Snowfall: graph
- Monthly Snowfall: ~90-year Average
- Snowstorms (date & amount) by Decade: 1920/30s | 40s | 50s | 60s | 70s | 80s | 90s | 00s | 10s | 20s
- All major snowstorms (12"+) since 1926
- All measurable snowfalls since 1926
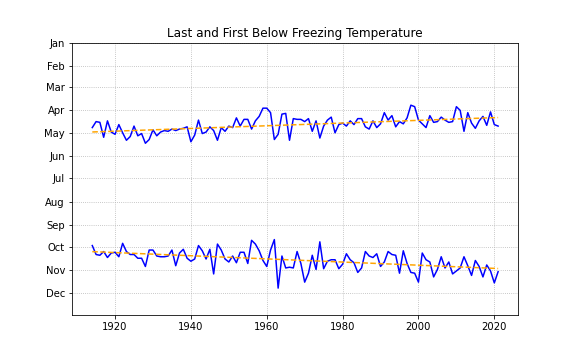
- First & last freezes (1914-2021): Graph | Graph w/Trendline
- List of all 24-hour Precip. Events >= 2 inches (1914-2026)
- 24-hour Precip. Events >= 2 inches by MONTH (1914-2026)
- 24-hour Precip. Events > 1 inch by MONTH (1914-2026)
-
Heat Data
Back to top- Annual 90-Degree Days: 1914 - 2025 | graph
- 90-Degree Days Per Decade: graph
- 100-Degree Days Per Decade: graph
-
Drought & Water Resource Data
Back to top- PA DEP: Current Drought Status
- Local Obs: Stream Flow | Well Depth to Water | Drought Streamflow Probabilities (Northeast US)
- Lancaster: Moving 120-day Precip & Drought Criteria
- USGS Water Monitoring: Home Page | Groundwater | Interactive PA Streamflow Map
- NWS Products: Drought Monitor | Soil Moisture | US Seasonal Drought Outlook | 7-day Avg. Streamflow
- ENSO update: NOAA's weekly report (ppt)