AEST Student Performance and Achievement Information
Six Year Trends: Fall Enrollment by Major/Option
Bachelor of Science (4YR):
|
||||||
| BS AETM Option (Current Curricula): | 21 | 22 | 23 | 24 | 25 | 26 |
| Computer-aided Design (CAD) | 48 | 59 | 62 | 53 | 51 | 45 |
| Construction Management | 59 | 52 | 68 | 83 | 101 | 108 |
| General Technology | 11 | 12 | 14 | 16 | 19 | 24 |
| BS AETM Option (Former Curricula): | ||||||
| Advanced Manufacturing 1 | 15 | 20 | 7 | 4 | 0 | 0 |
| Construction Technology 2 | 0 | 0 | 1 | 0 | 0 | 0 |
| Graphic Communication 3 | 23 | 15 | 8 | 0 | 1 | 1 |
| Graphic & Packaging Technologies 4 | - | - | 3 | 4 | 2 | 0 |
| Nanofabrication Manufacturing 5 | 4 | 4 | 0 | 0 | 0 | 0 |
| Robotics & Control Systems 6 | 31 | 30 | 22 | 7 | 1 | 0 |
|
Notes: 1 Advanced Manufacturing stopped admitting students in 2023; option was merged with Manufacturing Engineering Technology degree program. 2 Construction Technology was retitled Construction Management in 2017. 3 Graphic Communication was retitled Graphic & Packaging Technology merging with retired Packaging Engineering Technology in 2023. 4 Graphics & Packaging was merged with Computer-aided Design & Drafting and retitled as Computer-aided Design in 2026. 5 Nanofabrication Manufacturing was discontinued in 2022. 6 Robotics & Control Systems stopped admitting students in 2023; option was merged with Automation & Robotics Engineering Technology degree program. |
||||||
Bachelor of Science: Engineering technology (AURO, MFET, PET) |
||||||
| 21 | 22 | 23 | 24 | 25 | 26 | |
| Automation & Robotics Engineering Technology | 23 | 27 | 37 | 60 | 59 | 61 |
| Manufacturing Engineering Technology | 36 | 42 | 52 | 57 | 46 | 37 |
| Packaging Engineering Technology* | 1 | 1 | 1 | 1 | 0 | 0 |
|
Notes: *The Packaging Engineering Technology degree started admitting student in fall 2021. The Packaging Engineering Technology degree stopped enrolling students in fall 2023 and was merged with AETM Graphics & Packaging Technology. |
||||||
Associate of Technology (2Yr):
|
||||||
| AT AET Options (Current Curricula): | 21 | 22 | 23 | 24 | 25 | 26 |
| Advanced Manufacturing Technology | 4 | 3 | 3 | 1 | 1 | 5 |
| CADD | 6 | 8 | 7 | 6 | 2 | 5 |
| Construction Technology | 3 | 6 | 1 | 1 | 3 | 2 |
| Electronics/Control Systems Technology | 1 | 0 | 2 | 2 | 2 | 2 |
| Graphic Communication | 2 | 2 | 2 | 2 | 0 | 0 |
| Occupational Safety & Hygiene Technology | 0 | 1 | 1 | 2 | 0 | 3 |
Bachelor of Science: Occupational Safety & Environmental Health (OSEH) |
||||||
| 21 | 22 | 23 | 24 | 25 | 26 | |
| Occupational Safety & Environmental Health | 74 | 49 | 48 | 52 | 53 | 49 |
Bachelor of Science in Education: Technology Education (TECE) |
||||||
| 21 | 22 | 23 | 24 | 25 | 26 | |
| Technology & Engineering Education K-12 | 53 | 56 | 52 | 51 | 48 | 32 |
| Technology & Engineering Education K-12: Engineering Design Concentration | 11 | 7 | 7 | 9 | 7 | 7 |
| Technology & Engineering Education K12 with Inclusive Education 7-12 | 1 | 0 | 0 | 0 | 0 | 0 |
Graduate and Post-Baccalaureate:
|
||||||
| 21 | 22 | 23 | 24 | 25 | 26 | |
| M.S. Technology & Innovation: Education | 15 | 12 | 8 | 8 | 13 | 7 |
| M.S. Technology & Innovation: Enterprise | 11 | 7 | 10 | 8 | 9 | 5 |
| M. Ed.: Master's in Technology Education | 0 | 0 | 0 | 0 | 0 | 0 |
| Post-Baccalaureate Certification | 1 | 2 | 0 | 1 | 1 | 2 |
| Department Totals (fall enrollments) | 431 | 415 | 416 | 428 | 419 | 395 |
Degrees Awarded Annually by Major/Option
Bachelor of Science:
|
|||||||
| BS AETM Option: | 19-20 | 20-21 | 21-22 | 22-23 | 23-24 | 24-25 | 25-26 |
| Advanced Manufacturing | 5 | 4 | 4 | 1 | 1 | 3 | |
| CADD | 10 | 15 | 12 | 7 | 13 | 12 | |
| Construction Management * | 4 | 8 | 14 | 7 | 13 | 10 | |
| Construction Technology * | 0 | 0 | 1 | 0 | 0 | 0 | |
| General Technology | 3 | 1 | 1 | 1 | 3 | 5 | |
| Graphic Communication/Graphics & Packaging Tech. | 3 | 5 | 7 | 5 | 2 | 1 | |
| Nanofabrication Manufacturing Technology | 0 | 1 | 2 | 2 | 0 | 0 | |
| Robotics & Control Systems | 7 | 7 | 12 | 6 | 1 | 3 | |
|
Notes: * Starting with newly admitted students for spring 2017, the Construction Technology option was retitled Construction Management. * Effective Fall 2022, the Nanofabrication Manufacturing option is no longer enrolling new students.
|
|||||||
Bachelor of Science: Engineering technology (AURO, MFET, PET) |
|||||||
| 19-20 | 20-21 | 21-22 | 22-23 | 23-24 | 24-25 | ||
| Automation & Robotics Engineering Technology | 5 | 0 | 4 | 5 | 3 | 8 | |
| Manufacturing Engineering Technology | 2 | 3 | 4 | 12 | 8 | 13 | |
| Packaging Engineering Technology | 0 | 0 | 1 | 0 | 1 | ||
Notes:
|
|||||||
Associate of Technology:
|
|||||||
| AT AET/ITEC Option: | 19-20 | 20-21 | 21-22 | 22-23 | 23-24 | 24-25 | |
| Advanced Manufacturing Technology | 2 | 0 | 1 | 0 | 2 | 1 | |
| CADD Technology | 4 | 4 | 1 | 3 | 3 | 13 | |
| Construction Technology | 0 | 1 | 0 | 1 | 0 | 0 | |
| Electronics/Control Systems Technology | 9 | 0 | 2 | 1 | 1 | 5 | |
| Graphic Communication Technology | 3 | 2 | 0 | 2 | 1 | 3 | |
| Nanofabrication Manufacturing Technology | 0 | 1 | 0 | 0 | 0 | 0 | |
| Occupational Safety Technology | 23 | 0 | 0 | 0 | 0 | 1 | |
Bachelor of Science:
|
|||||||
| 19-20 | 20-21 | 21-22 | 22-23 | 23-24 | 24-25 | ||
| Occupational Safety & Environmental Health | 30 | 32 | 30 | 6 | 15 | 18 | |
Bachelor of Science in Education:
|
|||||||
| 19-20 | 20-21 | 21-22 | 22-23 | 23-24 | 24-25 | ||
| Technology & Engineering Education | 8 | 13 | 9 | 11 | 12 | 11 | |
| Technology & Engineering Education: Engineering Design Concentration | 2 | 1 | 3 | 1 | 0 | 1 | |
Graduate and Post-Baccalaureate:
|
|||||||
| 19-20 | 20-21 | 21-22 | 22-23 | 23-24 | 24-25 | ||
| M. Ed.: Masters in Technology Education | 3 | 3 | 0 | 0 | 0 | 3 | |
| M. S.: Technology & Innovation: Education | 8 | 9 | 7 | 6 | 2 | 2 | |
| M. S.: Technology & Innovation: Enterprise | 2 | 0 | 3 | 2 | 7 | 0 | |
| Department Totals | 133 | 110 | 117 | 80 | 87 | 114 | |
Retention Rate
First time, full and part time, associate or bachelor degree seeking:
| Year | Cohort | Retained | Retention % | Did not return |
| Fall 2024 to Fall 2025 | 77 | 60 | 77.9% |
17 |
| Fall 2023 to Fall 2024 | 60 | 50 | 83.3% |
10 |
| Fall 2022 to Fall 2023 | 91 | 77 | 84.6% | 14 |
| Fall 2021 to Fall 2022 | 85 | 64 | 75.3% | 32 |
| Fall 2020 to Fall 2021 | 58 | 49 | 84.5% | 9 |
| Fall 2019 to Fall 2020 | 74 | 65 | 87.8% | 9 |
Average Undergraduate Grade Point Averages (GPA) at Graduation
| AEST Majors | 2022-2023 | 2023-2024 | 2024-2025 |
| AETM-Computer-aided Design | 3.15 | 3.16 | 3.00 |
| AETM-Construction Manament | 3.08 | 3.23 | 2.99 |
| AETM-General Technology | 3.38 | 2.97 | 3.34 |
| AURO-Automation & Robitics Engineering Techology | 3.03 | 3.37 | 3.18 |
| MFET-Manufacturing Engineering Technology | 3.20 | 3.23 | 3.21 |
| TECE-Technology & Engineering Education | 3.60 | 3.55 | 3.47 |
| OSEH-Occupational Safety & Environmental Health | 3.19 | 3.29 | 3.07 |
| Department Overall Mean GPA | 3.16 | 3.28 | 3.125 |
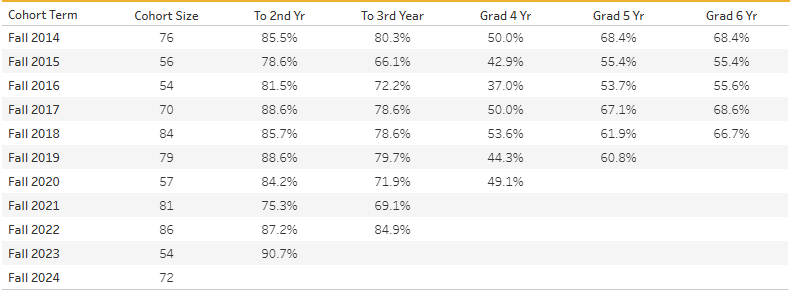
Persistence & Graduation Rates
Persistence and graduation rates for first time, full time, bachelor's degree seeking AEST students. The cohort size indicates the size of the incoming freshmen class for the indicated year.
Awards & Scholarships
The Department of Applied Engineering, Safety & Technology has 28 awards and scholarships available to all students across our degree offerings. Details on these awards annd scholarships can be viewed on our Awards & Scholarships page.
Millersville University also maintains a comprehensive database of available awards and scholarships.
tUITION
Millersville University charges tuition on a flat-fee model for all of its undergraduate programs. More information can be viewed on the Office of Student Accounts Web page.
AEST Career Placement Rates Reported
| AEST Majors | 2022-2023 | 2023-2024 | 2024-2025 |
| AETM-Computer-aided Design | 100% | 85.7% | 100% |
| AETM-Construction Manament | 100% | 100% | 100% |
| AETM-General Technology | 100% | 100% | 100% |
| AURO-Automation & Robitics Engineering Techology | 100% | 100% | 100% |
| MFET-Manufacturing Engineering Technology | 100% | 100% | 100% |
| TECE-Technology & Engineering Education | 100% | 100% | 100% |
| OSEH-Occupational Safety & Environmental Health | 89.9% | 90.9% | 100% |
Alumni Survey Self Reported Job Titles and Salaries
Applied Engineering, Safety & Technology reaches out to its alumni on a three year interval to collect information about student success. The links below will display the findings of the latest survey conducted in fall 2025 showing position titles and salaries.
2025 Alumni Self-Reported Position Titles and Salaries
- Applied Engineering & Technology Management (AETM) Titles and Salaries
- Engineering Technology (AURO, MFET) Titles and Salaries
- Occupational Safety & Environmental Health (OSEH) Titles and Salaries
- Technology & Engineering Education (TECE) Titles and Salaries
2022 Alumni Self-reported Position titles and Salaries
Employer Reported Satisfaction of Graduates
Employers of our graduates were asked to rate their employees on 12 criteria listed below. The rating was to be made as 4 being excellent to 1 being poor and not applicable. Average employer ratings are listed in the table below.
| Criteria | n | Average |
| Overall preparation for initial employment | 13 | 4 |
| Mastery of necessary skills and competencies for current position | 13 | 5 |
| Ability to work cooperatively with others | 13 | 3 |
| Potential for professional advancement | 13 | 4 |
| Oral communication skills | 13 | 5 |
| Written communication skills | 13 | 4 |
| Skills to function effectively as a member or leader of a technical team | 13 | 5 |
| Technical knowledge and skills | 13 | 4 |
| Managerial/professional knowledge, skills, and values | 12 | 3 |
| Technological problem solving ability in individual and cooperative environments | 13 | 4 |
| Ability to access, evaluate, and use information to design solutions to problems | 13 | 4 |